People Fall into Different Sensitivity Groups: Orchids, Tulips and Dandelions
9th May 2020 - By Prof Michael Pluess
About the authors
Prof Pluess is a developmental psychologist and one of the leading authors in the field of Environmental Sensitivity with specific expertise in the development and validation of sensitivity measures besides significant contributions to theories of Environmental Sensitivity. He leads several research projects on sensitivity.
Summary
Should we understand sensitivity as a continuous dimension that ranges from low to high or as a category, with some people being highly sensitive and others not?
In this blog I present research suggesting that sensitivity reflects a spectrum but that people can also be categorised into three sensitivity groups along this spectrum.
Sensitivity groups
It is well established that people differ in their sensitivity to the environment with some being more sensitive to experiences they make and others less.
For a long time the assumption was that only a small proportion of people are highly sensitive. Consequently, this understanding suggested that people can be categorised into two basic groups: those that are highly sensitive and those that are not highly sensitive. Most attention in research and practice has been directed at the highly sensitive group and much less, if any at all, at the less sensitive group.
As a result of this “two group” perspective and the focus on the highly sensitive group, much more is known about people that are highly sensitive. In addition, several tests, some with and many without much scientific support, have been developed in order to find out whether someone belongs to the highly sensitive group. Over time some authors started using the term “Highly Sensitive Person” (HSP) to describe those that fall into the sensitive group. However, no specific words were suggested to describe people that belong to the less sensitive group.
Orchids and Dandelions
In 2005, two leading researchers in the field of biological sensitivity, Prof Tom Boyce and Prof Bruce Ellis, introduced the flower metaphor of Orchids and Dandelions which they borrowed from the Swedish terms orkidbarne and maskrosbarne.
In their influential academic paper they proposed that children that are less sensitive, and therefore more resilient and robust, are a bit like “Dandelions” who tend to thrive in most circumstances. Highly sensitive children, on the other hand, can be seen more like “Orchids” who require a caring and nurturing environment in order to do well. Importantly, Orchids can develop particular delicacy and beauty when raised under the right conditions.
The Orchid-Dandelion metaphor further enforced the prevailing view that most people can be categorised into either being highly sensitive or not being sensitive. However, although the flower metaphor is plausible and very easy to understand, there wasn’t actually any research that confirmed the existence of these two distinct groups. In fact, most research measured sensitivity on a continuum from low to high rather than considering two sensitivity groups.
Testing for Multiple Sensitivity Groups
Early on in my own research, I observed that most sensitivity measures that I used, whether infant temperament, sensitivity scales, or genetic information based on multiple genes, seemed to reflect a normal distribution (i.e., a bell shaped curve).
This means that most people had a medium sensitivity with fewer people having particularly low or high sensitivity. Most common human traits, such as extraversion or conscientiousness, are distributed in a similar way. Hence, none of the data that I had access to seemed to point to the existence of two distinct sensitivity groups.
Importantly, this observation was only based on plotted distribution curves. The rigorous testing for the existence of sensitivity groups requires the use of more advanced statistical procedures. Together with my colleagues, we applied an approach called “Latent Class Analysis” to several of our large data sets from children, adolescents and adults, all of which completed the Highly Sensitive Child or Person scales.
Latent Class Analysis is a data-driven statistical approach which compares the individual profiles of people’s responses to all questions in the sensitivity scales in order to test whether different people within a sample fall into one, two, or more groups with similar types of response profiles within each group.
Orchids, Dandelions and Tulips
Based on my earlier observation that sensitivity reflects most likely a continuous dimension ranging from low to high, my assumption was that we would not find any support for the existence of different sensitivity groups.
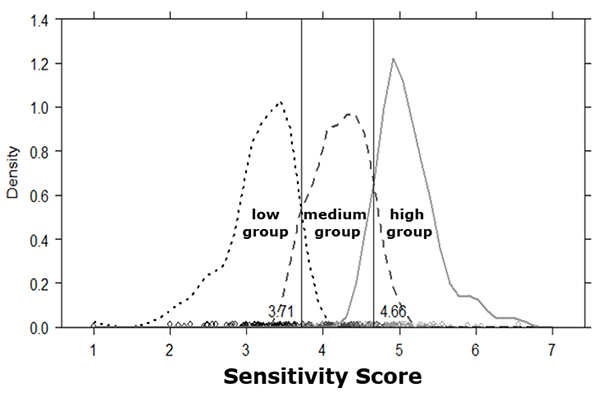
However, to my surprise, we found in most of our samples, whether they were children, adolescents, or adults, that people seem to fall into different sensitivity groups. But rather than two groups, all our analyses pointed towards the existence of three groups (see Figure 1).
Across all studies, we did find that about 30% of the sample population were characterised by particularly high sensitivity. Hence, this group reflects the “Orchids”. We also identified a group with relatively low sensitivity, the “Dandelions”, who made up another 30% of the population. Interestingly, the remaining 40%, and therefore the largest group of all three, had a medium level of sensitivity, somewhere between Orchids and Dandelions. In keeping with the flower metaphor, we named this group “Tulips” given that they are not as robust as Dandelions but also not as delicate as Orchids.
In summary, our research on the existence of sensitivity groups suggests that most people fall into one of three sensitivity groups: low, medium, and high. This also means that most people are relatively sensitive given that the medium and high sensitive groups together account for 70% of the population.
Important to mention, although there is strong evidence for the existence of these three sensitivity groups, it is not yet clear how and to what degree these groups differ from each other. Therefore, it may be more helpful to think of sensitivity as a spectrum from low to high along which some people fall into a low sensitive, others into a medium sensitive, and some into a high sensitive group.
Figure one
References
- Boyce, W. T., & Ellis, B. J. (2005). Biological sensitivity to context: I. An evolutionary-developmental theory of the origins and functions of stress reactivity. Development and Psychopathology, 17(2), 271-301.
- Lionetti, F., Aron, A., Aron, E. N., Burns, G. L., Jagiellowicz, J., & Pluess, M. (2018). Dandelions, tulips and orchids: evidence for the existence of low-sensitive, medium-sensitive and high-sensitive individuals. Translational Psychiatry, 8(1), doi: 10.1038/s41398-017-0090-6.
- Pluess, M., Assary, E., Lionetti, F., Lester, K. J., Krapohl, E., Aron, E. N., & Aron, A. (2018). Environmental sensitivity in children: Development of the Highly Sensitive Child Scale and identification of sensitivity groups. Developmental Psychology, 54(1), 51-70. doi: 10.1037/dev0000406